

Sidebar reference
Every entry in the sidebar of the data platform web interface, what it opens, and where to learn more about it
The sidebar of the data platform web interface groups its entries into sections. The tables below list the entries of each section in the order they appear, with the icon that the sidebar shows for them.
Database related
The views in this section work with the database that is selected in the database selector.
| Icon | Entry | What you do there | Learn more |
|---|---|---|---|
| Dashboard | Check the health of the deployment, such as the status of the Coordinators, DB-Servers, and Agents, and how shards are distributed. | Cluster | |
| Query Editor | Write, run, explain, and profile AQL queries in tabs, save queries, and generate or optimize queries with AI assistance. | Query Editor | |
 | Graphs | List, create, and delete named graphs, and open a graph in the Graph Visualizer. | Graph Visualizer |
| Management | Open the administration views of the ArangoDB core database system, see Management menu. | Web Interface (ArangoDB) |
Agentic AI Suite
| Icon | Entry | What you do there | Learn more |
|---|---|---|---|
| AutoGraph Studio | Create projects that turn your documents into a Context Graph and deploy retrievers to answer questions from it. | AutoGraph web interface | |
| Graph Analytics | Start Graph Analytics Engines and run graph algorithms such as PageRank on them. | Graph Analytics web interface | |
| GraphML | Create GraphML projects and run featurization, training, and prediction jobs. | GraphML web interface | |
| Ada (beta) | Ask questions about your database in natural language and let the AI assistant run queries for you. | Ada |
Other services
These entries have sub-entries. Click an entry to expand it in the sidebar.
| Icon | Entry | Sub-entries | Learn more |
|---|---|---|---|
| Applications | All apps, followed by one entry per deployed app that has its own user interface. | Apps | |
| AI Tools | Notebook servers to run Jupyter notebooks, and MLFlow to track experiments and manage models. | Notebook servers | |
| Monitoring | Grafana dashboards and Prometheus metrics. | Monitoring |
Admin
| Icon | Entry | What you do there | Learn more |
|---|---|---|---|
| Databases | List, create, and delete databases. | Databases | |
| Secrets | Store API keys and credentials, for example, for LLM providers, so that services can use them without exposing them. | Secrets Manager | |
| File Manager | Review uploaded service packages and RAG input files, and delete the ones no service uses anymore. | File Manager | |
| Container Manager | Deploy your own services from code packages or container images and manage running instances. | Container Manager web interface |
Management menu
Clicking Management opens a second panel next to the sidebar with the administration views of the ArangoDB core database system. These views work with the database selected in the database selector.
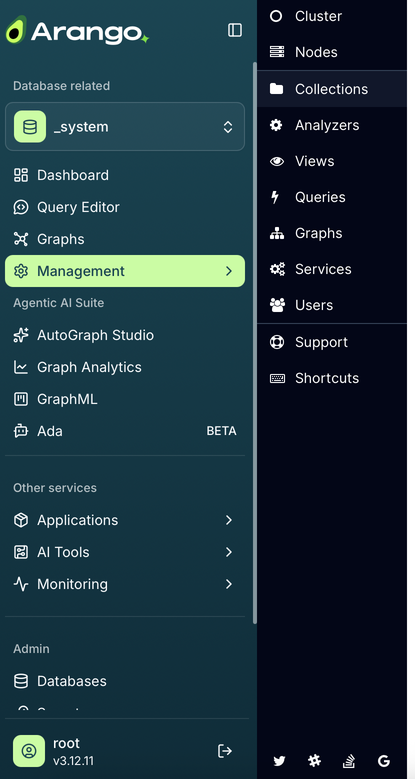
| Icon | Entry | What you do there | Learn more |
|---|---|---|---|
| Cluster | View statistics and the health of the cluster. | Cluster | |
| Nodes | List the Coordinators, DB-Servers, and Agents with their endpoints, versions, and status, and see how shards are distributed. | Cluster | |
| Collections | List, create, and configure collections, and browse their documents. | Collections | |
| Analyzers | List and create Analyzers for full-text search. | Analyzers | |
| Views | List and create arangosearch and search-alias Views. | ArangoSearch | |
| Queries | Run AQL queries and review running and slow queries. | Queries | |
| Graphs | List and create named graphs, including SmartGraphs, SatelliteGraphs, and EnterpriseGraphs. | Graphs | |
| Services | Install and manage Foxx microservices. | Services | |
| Users | Create user accounts and manage their permissions. | Users | |
| Support | Find links to the documentation, community, and support channels, and browse the HTTP API. | ||
| Shortcuts | Look up the keyboard shortcuts of the web interface. |
The icons at the bottom of the Management panel link to the Arango community channels.