

Get to know the data platform web interface
A tour of the unified web interface of the Contextual Data Platform: the sidebar, the database selector, the sidebar footer with the version number, and the workspace where you do your work
The Arango Contextual Data Platform comes with a unified web interface that brings the ArangoDB core database system and the services of the data platform together in a single place, including the AI services if your deployment has the Agentic AI Suite. Every feature uses the same layout and the same controls, so once you know your way around one part of the interface, you know your way around all of it.
To open the web interface, append /ui/ to the base URL of your deployment,
for example, https://<EXTERNAL_ENDPOINT>:8529/ui/, and
log in with
an ArangoDB user account.
The workspace at a glance
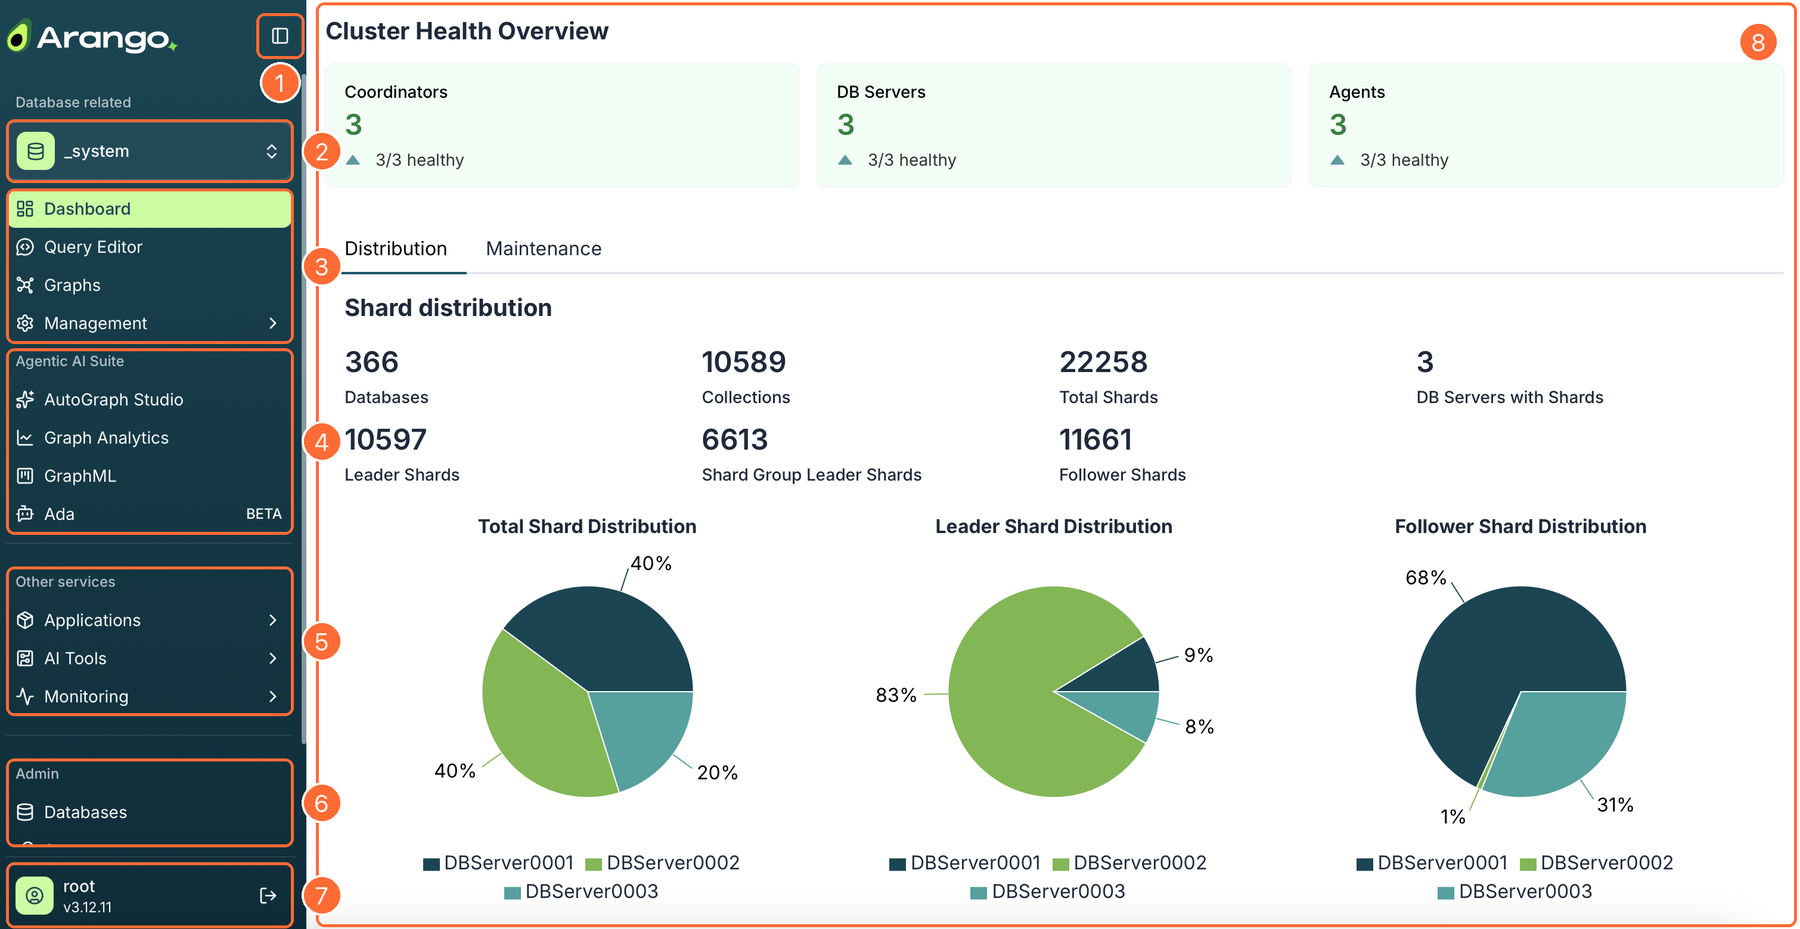
- Sidebar toggle: Collapse the sidebar to get more room for your work, and expand it again.
- Database selector: The database you are currently working in. Switch to another database at any time.
- Database tools: Work with the data of the selected database, using the Dashboard, Query Editor, Graphs, and Management views.
- Agentic AI Suite: Build Context Graphs with AutoGraph Studio, run Graph Analytics and GraphML jobs, and talk to your data with Ada.
- Other services: Open deployed Applications, AI Tools such as notebook servers and MLflow, and the Monitoring dashboards.
- Admin: Manage Databases, Secrets, the File Manager, and the Container Manager.
- Sidebar footer: The user you are logged in as, the ArangoDB version, and the logout button.
- Workspace: The main area where the selected view opens.
For a description of every sidebar entry, with the icon it uses and where to find its documentation, see the Sidebar reference.
Sidebar
The sidebar on the left-hand side is how you move between the features of the data platform. Its entries are grouped into sections, and each section has a heading so you can tell at a glance which part of the platform an entry belongs to.
- The entry of the view you are looking at is highlighted.
- An entry with a chevron () has sub-entries. For Applications, AI Tools, and Monitoring, the sub-entries open inside the sidebar. Management opens a second panel next to the sidebar instead, see Management menu.
- A BETA label next to an entry marks a feature that is still in beta and may change before it becomes generally available.
- If the sidebar is taller than your browser window, scroll it to reach the sections further down, such as Admin.
- Click the icon next to the Arango logo () to collapse or expand the sidebar.
The entries you see can differ depending on the components installed in your deployment. For example, the Agentic AI Suite section is only available if your data platform is licensed with the Agentic AI Suite, see Features and licensing.
Database selector
Most of what you do in the web interface happens in the context of a single
database. The database selector under the Database related heading shows
the database you are working in, for example, _system.
To switch to another database, click the selector, which shows the name of the current database followed by an up-and-down arrow icon (), and choose a database from the list. Only the databases your user account has access to are listed. The views below the selector, such as the Query Editor and Graphs, then show the data of the newly selected database.
To create or delete databases, go to Admin > Databases.
Sidebar footer
The footer at the bottom of the sidebar shows who you are logged in as and which version of ArangoDB you are connected to.
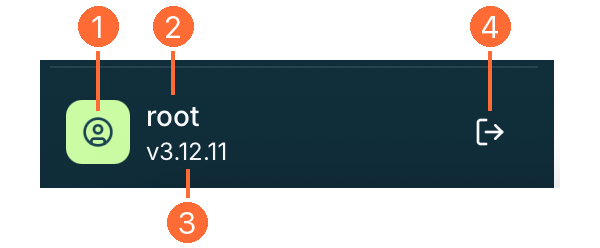
- Avatar: Represents your user account.
- Username: The ArangoDB user account you logged in with, for example,
root. What you can see and do in the web interface is limited by the permissions of this account. - Version number: The version of the ArangoDB core database system,
for example,
v3.12.11. - Log out: The icon on the right-hand side of the footer (). Ends your session and takes you back to the login screen.
Workspace
When you select an entry in the sidebar, its view opens in the workspace to the right of the sidebar. Views follow a common structure:
- A page title at the top, sometimes preceded by a breadcrumb trail that shows where you are, such as Agentic AI Suite / Graph Analytics.
- A primary action button next to the title, such as Add graph or New Project, to create something new.
- Tabs to switch between the parts of a view, such as Distribution and Maintenance on the Dashboard.
- The content of the view, often a list of items you can open, filter, and act on.