

ArangoDB 3.11 reached End of Life (EOL) and is no longer supported.
This documentation is outdated. Please see the most recent stable version.
Dashboard
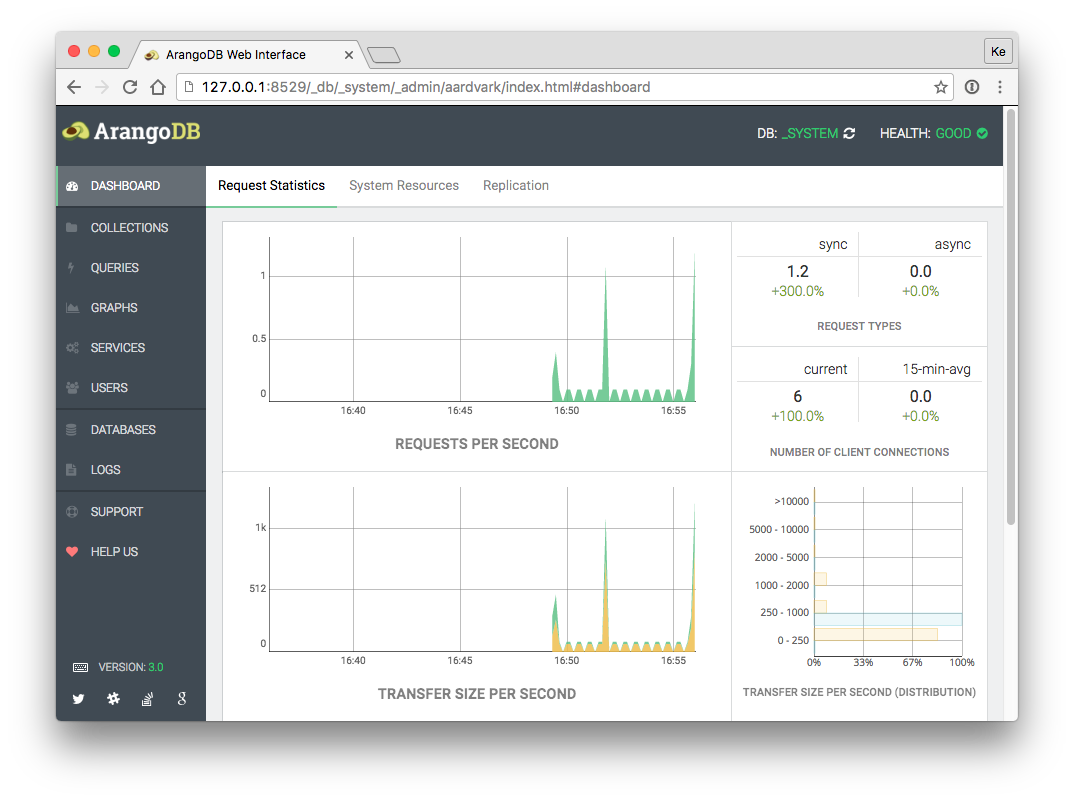
The home screen of the ArangoDB web interface
The DASHBOARD section provides statistics which are polled regularly from the ArangoDB server.
There is a different interface for Cluster deployments.
Statistics:
- Requests per second
- Request types
- Number of client connections
- Transfer size
- Transfer size (distribution)
- Average request time
- Average request time (distribution)
System Resources:
- Number of threads
- Memory
- Virtual size
- Major page faults
- Used CPU time
Replication:
- Replication state
- Totals
- Ticks
- Progress