

How to use Graph Analytics in the web interface
Learn how to manage Graph Analytics Engines (GAEs), load graphs, run algorithms, monitor jobs, and store results using the web interface of the Arango Contextual Data Platform
The Graph Analytics web interface in the Arango Contextual Data Platform provides a graphical way to run graph algorithms on your data. You can start engines, load graphs into memory, execute algorithms with custom parameters, monitor job progress, and store the computed results in a collection of your database.
The web interface is a front-end for the HTTP API and provides the same set of features. To look at the computed values, store them in a collection first, then query them with AQL or inspect the result documents.
The Graph Analytics workflow in the web interface
The typical workflow follows these steps:
- Engine Management: Start a Graph Analytics Engine with the right size for your data.
- Graph Loading: Load graph data from your database into the engine’s memory.
- Algorithm Execution: Run graph algorithms (PageRank, Connected Components, Label Propagation, etc.).
- Job Monitoring: Track the execution of algorithms in the Jobs History.
- Result Storage: Write the results of completed jobs to a dedicated collection in your database.
How to access the Graph Analytics interface
- From the left-hand sidebar, select the database you want to work with.
- In the left-hand sidebar, click Agentic AI Suite, then click Graph Analytics.
- The Graph Analytics Engine interface opens.
Engine management
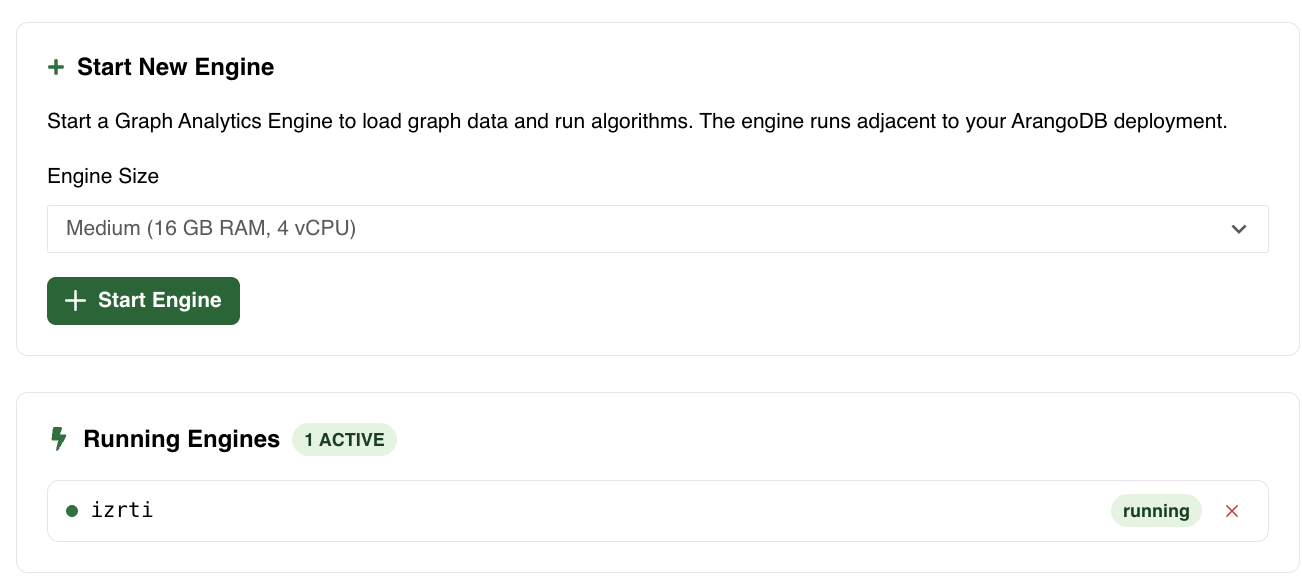
Before running any algorithms, you need to start a Graph Analytics Engine. The Running Engines panel on the right side of the interface shows all active engines with their unique engine IDs and current status.
Start a new engine
- In the right panel under Running Engines, click Start New Engine.
- Select an Engine Size based on your graph data requirements:
- Small: 1 GB RAM, 1 vCPU
- Medium: 16 GB RAM, 4 vCPU
- Large: 32 GB RAM, 8 vCPU
- Click Start Engine.
The engine typically starts within a few seconds and appears in the Running Engines list.
Stop or remove an engine
To stop and remove an engine, click the icon next to it in the Running Engines list.
You can have multiple engines running simultaneously, each maintaining its own loaded graphs and job history. You can also unload a graph from an engine.
Load graph data into engine memory
Before running algorithms, load the graph data from your database into the engine. Follow these steps:
- Ensure you have a running engine selected in the Select Engine dropdown menu.
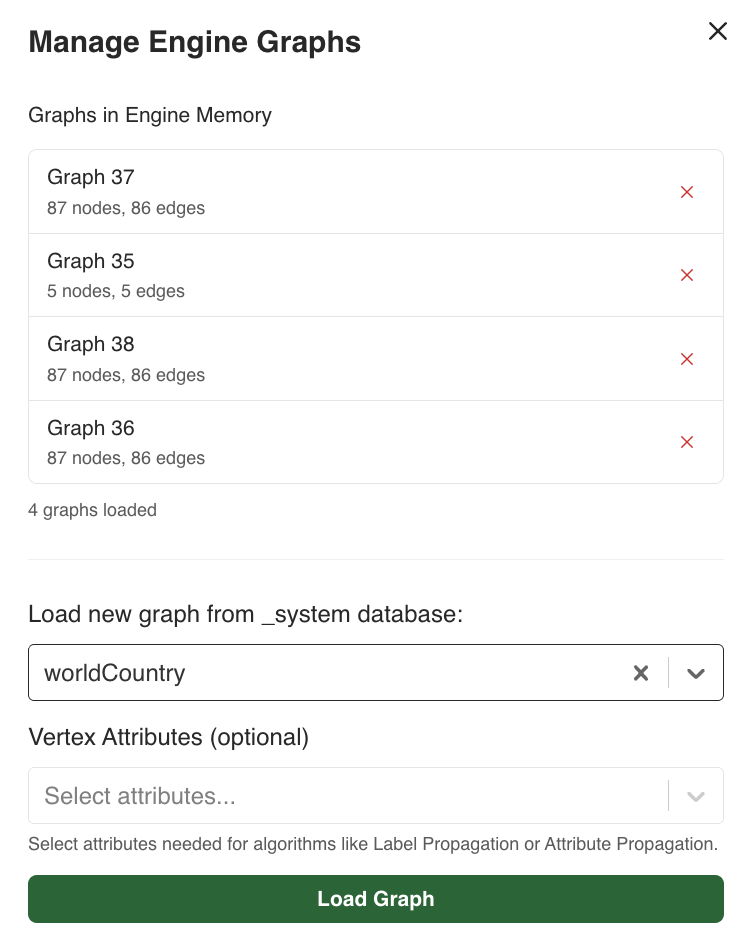
- In the Select Graph dropdown menu, click Load New Graph.
- The Manage Engine Graphs dialog opens, showing:
- Graphs in Engine Memory: Currently loaded graphs with their Graph ID, the number of nodes and edges.
- Load new graph from database.
- Select a graph from your database.
- Optionally, select Vertex Attributes if your algorithm requires specific node attributes (e.g., for Label Propagation or Attribute Propagation).
- Click Load Graph.
The load operation runs as a job. Once it is completed, the graph appears in the engine memory list as loaded.
To remove a graph from memory and free up space, click the button next to it in the Manage Engine Graphs dialog.
Run algorithms
The Algorithm Execution section lets you configure and run graph algorithms. Follow these steps:
- Select Engine: Choose the active engine to use.
- Select Graph: Pick a graph loaded in the engine’s memory. The interface shows the graph name, the number of nodes and edges, and a Ready to use indicator.
- Select Algorithm: Choose from the available algorithms.
- Configure Parameters. These are specific to each algorithm.
- Click Run Algorithm.
Each algorithm execution creates a job that you can monitor in the Jobs History. See the complete list of available algorithms in Graph Analytics.
Available algorithms
Graph Analytics supports multiple algorithms for various analysis tasks:
- PageRank: Node importance ranking
- Weakly Connected Components (WCC): Find groups connected by any path
- Strongly Connected Components (SCC): Find groups with directed cycles
- Betweenness Centrality: Identify key connectors and bridges
- LineRank: Edge importance ranking
- Label Propagation: Fast community detection
- Attribute Propagation: Label accumulation and tracking
For detailed descriptions, parameters, and use cases, see the Available Algorithms overview or the HTTP API documentation.
Monitor jobs
Click View Jobs History in the top right to open a detailed view of all algorithm executions. It lets you track the progress of running jobs and see which jobs have completed or failed. It does not show the computed values - to access them, store the results in a collection first.
The Jobs History table displays:
| Column | Description |
|---|---|
| Job ID | Unique identifier for the operation |
| Graph ID | Which graph the algorithm ran on |
| Algorithm | The executed algorithm name |
| Status | Current state: COMPLETED, RUNNING, or FAILED |
| Progress | Completion percentage (0-100%) |
| Duration | Execution time |
| Memory | Peak memory usage during computation |
| Actions | Store the results to a collection or delete the job |
Store results to a collection
The results of an algorithm are computed in the engine memory. To keep them and to be able to query them, write them to a collection of your database:
- Open the Jobs History and locate a job with the
COMPLETEDstatus. - Click the icon in the Actions column.
- Specify the target collection and the attribute name to store the results under. The collection needs to exist already.
- The results are written to the collection.
You can also use the Store Results API to
programmatically write results with custom configuration such as setting
the degree of parallelism and the batch_size for saving the data.
Best practices
Choosing the right engine size
| Graph Size | Recommended Engine |
|---|---|
| Small (<10k nodes) | Small (1 GB RAM) |
| Medium (10k-1M nodes) | Medium (16 GB RAM) |
| Large (>1M nodes) | Large (32 GB RAM) |
Always account for both graph data and computation results when selecting engine size.
Efficient graph loading
- Load graphs once and reuse them for multiple algorithm runs.
- Remove unused graphs to free memory.
- Select only necessary vertex attributes to reduce memory usage.
- For large graphs, test on a subgraph first to estimate resource requirements.
For more detailed troubleshooting and advanced configuration, see the HTTP API documentation.